Welcome to OpenEBench documentation!
OpenEBench, the ELIXIR platform for benchmarking, aims to address the main benchmarking challenges for life-sciences tools and workflows. It is based on three pillars:
BENCHMARKING EVENTS
|
ASSESSMENT OF RESEARCH SOFTWARE
|
|
Support of
SCIENTIFIC BENCHMARKING
protocols for assessing the scientific
performance of bioinformatics methods
in a qualitative and reproducible manner.
|
Systematic
SOFTWARE MONITORING
of bioinformatics tools, server and workflows for
assessing software-quality metrics at individual
level.
|
Provision of a
SOFTWARE OBSERVATORY
for assessing the technical efficiency of
bioinformatics tools, servers and/or workflows.
|
Find more about the platform here!
Overview
OpenEBench is an infrastructure designed to establish a benchmarking system for bioinformatics methods, tools and web services. It is part of the ELIXIR Tools platform and its development is led by the Barcelona Supercomputing Center (BSC) in collaboration with partners within ELIXIR and beyond.

OpenEBench is being developed so as to cater for the needs of the bioinformatics community, especially software developers who need an objective and quantitative way to inform their decisions as well as the larger community of end-users, in their search for unbiased and up-to-date evaluation of bioinformatics methods. The goals of OpenEBench are to:
Provide guidance and software infrastructure for Benchmarking and Techincal monitoring of bioinformatics tools.
Engage with existing benchmark initiatives making different communities aware of the platform.
Maintain a data warehouse infrastructure to keep record of Benchmarking initiatives.
Expose benchmarking and technical monitoring results to Elixir Tools registry.
Establish and refine communication protocols with communities and/or infrastructure projects willing to have a unified benchmark infrastructure Coordinate with Elixir.
Interoperability Platform to keep FAIR data principles on Benchmarking data warehouse.
In OpenEBench you will be able to find three types of activities:
Scentific Benchmarking
Assessment of Research Software quality
Software Observatory
Community-driven Scientific Benchmarking efforts
Scientific benchmarking helps determine the precision, recall and other metrics of bioinformatics resources in unbiased scenarios, which have been set up through reference databases, ad-hoc input and test data sets reflecting specifying scientific challenges. Chosen metrics allow us to objectively evaluate the relative scientific performance of the different participating resources. Communities are the cornerstone of the benchmarking effort in OpenEBench because they are the domain experts with the necessary expertise to identify, define and select the data sets deemed as the ground truth for the benchmarking and the quantitative metrics that best determine the performance of the evaluated tools.
Scientific communities in OpenEBench provide a way for software developers to implement more efficient methods, tools and web services by doing scientific benchmarking, which compares their performance on previously agreed data sets and metrics with other similar resources. In addition, it helps individual researchers that tend to have difficulties in choosing the right tool for the problem at hand, and are not necessarily aware of the latest developments in each of the fields of the bioinformatics methods they need to use.
Assessment of Research Software quality
Software quality is a key issue in research, as the quality of scientific outcomes is clearly interconnected with the quality of the tools used to deliver them. Bioinformatics as a whole has been largely accused of generating poor research software due to the prioritization of the quick results over the optimization and standardization of the tools used. This is not unexpected, as bioinformatics is a fast evolving field. Accepted algorithms become obsolete far before the software made out of them can reach the usual quality standards normal in other disciplines. While this is traditionally accepted as normal use by researchers, it puts strong questions in the reproducibility of research results and on the validity of processed data deposited in large archives like, for instance, the European Genome-Phenome Archive. OpenEBench, as indicated above, holds a specific infrastructure to monitor software quality.
Software Observatory of Quality Research Software
Research software tend to evolve over time as response of continuous innovation. Innovation can be of technological nature, e.g. more powerful computational resources, or of scientific nature, e.g. development of new algorithms, emergence of new data types. Thus, it is important to capture those changes over time into a reference place where communities can easily access to it. Research software observatories have been conceived as those places where a given community can bring together their relevant resources, particularly software. Software observatories should then ensure that all changes produced in the software are pertinently captured to provide an up-to-date view of the activities in a particular scientific domain. Those efforts would be ideally complemented with relevant resources to the community. Resources can include reference data sets for conducting technical and scientific benchmarking, either individually and as a part of community-agreed assessments, as well as software development best practices, training materials, among others.
Benchmarking Perspectives
In bioinformatics, benchmarking activities can be considered from three perspectives; the technical, the scientific and the functional ones:
Technical benchmarking usually focuses on technical quality metrics, such as, for instance, whether it can be compiled with no errors, resources needed along the execution (storage, memory), the reproducibility of the results, and portability, among others. In the case of services, relevant features are accessibility, up-time, communication protocols, response time, processing speed, and interoperability.
Scientific benchmarking, on the other hand, determines the performance of bioinformatics resources in the context of predefined reference datasets and metrics reflecting specific scientific challenges. Some metrics relate to experimental readouts used as standards of truth while others merely quantify some level of optimization. Those metrics allow to objectively evaluate the relative scientific performance of the different participating tools and, what is more, with a deep scientific knowledge and substantial information about the corresponding tools it is even possible to understand what are the tools potential biases, strengths and weaknesses or under which conditions do tools underperform. What is more, benchmarking can also provide quality control for new resources or releases of established resources; often, developers present a new tool and, once it is challenged in a benchmarking event, they decide not make their results publicly available, presumably after discovering poor outcome in some of the benchmarks. This clearly demonstrates the effectiveness of a community benchmarking service for quality control.
Functional benchmarking performs a user-based evaluation of software usability. Some relevant aspects that determine the usability of a given software are: how intuitive and easy-to-use is the interface; if there exists clear and comprehensive user documentation; whether software customizes the user experience according to predefined roles when more than one profile is available; whether it is linked to data repositories that are updated frequently; if there are communities around the software aiming to support users and/or developers; whether the software is open source and licenses are properly indicated.

Background
Here you can find the rationale behind OpenEBench and how it fits in ELIXIR.
Why benchmarking in bioinformatics?
Benchmarking consists of measuring the performance of some physical process under the same conditions by using specific indicators that depend on the field, resulting in one or more values that are then compared to others. Nowadays, it is used in almost every field, from business and finances to industry and computation. In computation, benchmarking can be performed from a technical, functional and/or scientific perspective. The more aspects are considered (e.g. technical, scientific, functional) when comparing software, the better the evaluation of the software being compared.
The dependence of life scientists on software has steadily grown in recent years: researchers at public institutions and private enterprises all over the world are constantly developing new computational resources and improving the existing ones to make life sciences research more accurate, quicker and more efficient. Thus, it is not surprising that benchmarking has become an essential process within the bioinformatics field; for many tasks, researchers have to decide which of the available bioinformatics software are more suitable for their specific needs and, if possible select the one that provides the highest accuracy, the best efficiency and the highest level of reproducibility when integrated in their research projects and/or daily practice. This is nowadays widely utilized to analyze the efficiency of several algorithms and/or workflows used for various purposes such as sequence alignment, protein structure or/and orthology prediction among others.
OpenEBench provides a neutral framework that scientific communities can use to run benchmarking initiatives, store the results and make them publicly available.
OpenEBench in ELIXIR
ELIXIR is an intergovernmental organization that brings together life science resources from across Europe https://www.elixir-europe.org. These resources include databases, software tools, training materials, cloud storage and supercomputers.
The goal of ELIXIR is to coordinate these resources so that they form a single infrastructure that makes it easier for scientists to find and share data, exchange expertise, and agree on best practices and, ultimately, help them gain new insights into how living organisms work.
More concretely in benchmarking, there is a clear need of establishing standards, relevant scientific challenges and meaningful metrics by knowledgeable scientific communities. However, those efforts should be complemented by a stable platform which can support these activities, provide a reference place for different stakeholders and give a general overview on how tools and workflows, scientific challenges, metrics and data sets evolve over time.
OpenEBench is the ELIXIR benchmarking and technical monitoring platform for bioinformatics tools, web servers and workflows. OpenEBench is part of the ELIXIR Tools platform and its development is led by the Barcelona Supercomputing Center (BSC) in collaboration with partners within ELIXIR and beyond.
Within the ELIXIR project, OpenEBench is being developed under the Tools Platform at the Work Package 2 (WP2: Benchmarking). The focus of this WP is on:
Assessing bioinformatics methods in terms of quantitative performance and user friendliness. Organize and support relations to biology and medicine communities already running benchmarking exercises.
Develop and maintain a generic infrastructure for benchmarking exercises in different subareas.
Develop the technology to perform online, uninterrupted methods assessment in key areas of bioinformatics.
Develop and implement data warehouse infrastructures to store benchmarking results and make them accessible to developers and end-users for subsequent transfer to other ELIXIR and non-ELIXIR platforms e.g. ELIXIR registry bio.tools.
Develop the procedures to create standards for benchmarking in different areas.
All OpenEBench components have been designed and implemented following the recommendations made by the ELIXIR tools platform e.g. making code available in public repositories from day 1; are available as software containers, and use workflow managers promoted by ELIXIR. Next figure illustrates the interconnection of OpenEBench to other ELIXIR tools platforms systems and platforms and beyond.

Hence, OpenEBench is a platform designed to establish a continuous automated benchmarking system for bioinformatics methods, tools and web services. This infrastructure implements a system for storing and sharing benchmarking results and allows to perform benchmarking experiments. It scales according to the number of participants and allows centralized collaborative efforts to define reference data sets.
This framework integrates optimally the decision-making capabilities of communities and involved groups. In order to engage and keep the interaction among community members, it is important to have a website which provides both friendly and unified programmatic access across different resources at the benchmarking platform. This central access point facilitates data exchange, and promote results dissemination. Thanks to the use of various APIs (Application Programming interfaces) for the creation and deployment of web services, content sharing between this central access point and external providers (i.e. communities and software registries) is facilitated, allowing OpenEBench users to conduct continuous automated benchmarking tests online.
Objectives of OpenEBench
In summary, the goals of OpenEBench are to:
Provide guidance and software infrastructure for Benchmarking and Technical monitoring of bioinformatics tools.
Engage with existing benchmark initiatives making different communities aware of the platform.
Maintain a data warehouse infrastructure to keep record of Benchmarking initiatives.
Expose benchmarking and technical monitoring results to other ELIXIR and non-ELIXIR resources.
Establish and refine communication protocols with communities and/or infrastructure projects willing to have a unified benchmark infrastructure Coordinate with ELIXIR.
Work with the ELIXIR Interoperability Platform to keep FAIR data principles on the Benchmarking data warehouse.
Benefits to all stakeholders
Thanks to these principles, OpenEBench will offer support to Developers, Communities, End-Users and Funders:
Developers are able to reach their work and compare their tools with others, which demonstrates their utility and, ultimately, helps to improve their methods and disseminates their results thanks to publications and results spreading.
Communities foster advances and identify new challenges/issues in their concrete area by providing assessment metrics, contributing to results dissemination and establishing good practices.
End-users mainly benefit, as we explained before, from getting guidance about choosing the best tool for their research needs and being aware of the latest advancements in the area by getting information from trusted experts and staying up to date with methods and tools.
Funders are able to maximize benefits in projects which include the development of new software resources and/or improve the existing ones.

Community-driven Scientific Benchmarking
Basic concepts
Unbiased and objective evaluations of bioinformatics resources are often challenging to set-up and can only be effective when built and implemented around community driven efforts. It is a complex process entirely relying on intense cooperation among the members of the community. These communities can be effectively strengthened by challenge-based competition with clear participation rules, a scientific sound set of questions, and agreed common data sets. Provided a critical mass of software developers is reached, competition eventually ends up bringing stimulated rewards and invaluable feedback about potential improvements for individual solutions.
Communities are a group of people that face similar problems and want to collaborate in finding the best solutions and resources to face them. The communities are going to define how the performance of the resource should be evaluated, which includes the definition of the metrics and reference datasets that they want to use for the benchmarking, which sometimes is not an easy task since they should reflect existing challenges of the scientific community in terms of size, complexity, and content. Also, the metrics that are used to measure the performance of individual participants should reflect the common practices in the field.
OpenEBench has engaged with different communities offering assistance to bring their data and activities into the platform. However, how communities use the platform depends on their specific needs and resources. Benchmarking of bioinformatics software also adds value to the communities by providing objective metrics in terms of scientific performance, technical reliability, and perceived functionality. At the same time, target criteria agreed within a community are an effective way to stimulate new developments by highlighting challenging areas. To ensure the long-term sustainability of OpenEBench, a co-production model is implemented to accelerate the incorporation of new communities and the maintenance of the existing ones.
Communities can focus on specific problems, e.g. Quest for Orthologs (QfO); or having a broader spectrum e.g. Spanish Network of Biomedical Research Centers on Rare Diseases (CIBERER); or covering different challenges on each of their editions, e.g. DREAM Challenges. Benchmarking efforts led by scientific communities might have a national scope e.g. CIBERER; or a global one e.g., Global Microbial Identifier Initiative (GMI).
Community engagement model
OpenEBench community engagement model has three different levels that allow communities at different maturity stages to make use of the platform.
Level 1 is used for the long-term storage of benchmarking results aiming at reproducibility and provenance.
Level 2 allows the community to use benchmarking workflows to assess participants’ performance. Those workflows compute one or more evaluation metrics given one or more reference datasets.
Level 3 goes further and the whole benchmarking process is performed at OpenEBench. Therefore, in this level, the participants’ tools that are going to be evaluated are also run by OpenEBench.
Importantly, each level makes use of the characteristics defined in the previous level e.g. participants’ data generated by workflows at Level 3 are evaluated using the metrics and reference datasets in Level 2, and the resulting data is stored following the data model in Level 1 for private and/or public consumption.

OpenEBench benchmarking process
The benchmarking process starts in the execution of the tools or workflows with some input datasets in order to get the predictions that are going to be used for the benchmarking. It is recommended that the input datasets are stored in a public repository, like ENA or EGA. This implmentation in OpenEBench is still under construction and therefore it should be run by the members of the community previously. This can be done, for example, using Galaxy, Nextflow or Common Workflow Language.
Once the predictions are available, it is possible to run the benchmarking workflow which includes three steps: validation, metrics computation and results consolidation. During the validation, the input file format is checked and the content of the file is validated. Then, during the metrics computation, the predictions are compared with the reference datasets in order to evalaute the performance of each tool by different metrics. Finally, during the consolidation, the results of a particular tool are merged into the community’s data. This step is performed in the Virutal Research Environment (VRE) and it allows the community to use benchmarking workflows to assess participants’ performance.
The final step of the bechmarking process is the long-term storage of benchmarking events and challenges to make the results of the performance of the tools avilable in the OpenEBench webpage. It is important that researchers can access these results at any time, and have the tools to assist them in understanding them.

Assessment of Research Software Quality
As any product, software components may differ in their characteristics that overall may refer as a software quality. Although the number of quality characteristics or metrics may be extensively large, their weight in the overall perceived quality is different. Many of the metrics are quite similar and may be grouped in a few groups related to the software development process. “ISO/IEC 9126-1:2001 Software engineering - Product quality document” defines usability, sustainability and maintainability as a main software quality parameters. OpenEBench provides a model for more than 50 metrics to assess bioinformatics tools quality.
FAIR principles for research Software
Data-driven research is not only limited and determined by the findability, accessibility, interoperability and reusability of data. Following the success of the FAIR Guiding Principles, several efforts have been made to apply them to sofware (Towards FAIR principles for research software, FAIR4RS WG) and other artifacts constitutive of research, such as workflows. The Tools Observatory approaches software quality in line with these developments.
Relevant References:
TECHNICAL REFERENCES: Software Metrics
GENERAL CONCEPTS > PLATFORMS: Tools Observatory
Platforms
OpenEBench ecosystem is composed by set of autonomous platforms and services well crosslinked to offer a integrated benchmaking platform. However, they well can be consumed independently, as they acomplish independent functionalities.
- OpenEBench Web Portal
https://openebench.bsc.es. The main landing page centralizing the access to all OpenEBench services and data. It integrates both, technical and scientific benchmarking platforms.
- Virtual Resarch Environment
https://openebench.bsc.es/vre. The online workspace for organizing and participating to scientific benchmarking events and challenges.
- Tools Observatory
https://observatory.openebench.bsc.es. The web portal that focuses on aggregated statistics of bioinformatics tools and services.
- Web Components
A catalogue of web-based widgets to easely embbed OpenEBench benchmarking data and results into external web sites.
Find below detailed information on each of these components:
OpenEBench Web Portal
The OpenEBench Web Portal is a web page where the final results of the benchmarking events are published. The data from the benchmarking event can come from different sources, depending on the community level of engagement:
The community has used the Virtual Research Environment to make the comparative evaluation and later on this data is published to OpenEBench.
The community has its own way to perform the comparative evaluation and wants to make the results public in a web page like OpenEBench.
OpenEBench Web Portal |
|---|
Virtual Research Environment
The OpenEBench Virtual Research Environment (VRE) enables the organization of OEB benchmarking events and the participation to them. The platform is a cloud-based computational e-infrastructure that triggers the execution of the Benchmarking Workflows associated to each event or challenge. The final outcome of the calculation is a set community-agreed assessment metrics that quantitatively and objectively evaluate the given participant’s dataset.
OpenEBench Virtual Research Environment (VRE) |
|---|
OpenEBench VRE offers a complete web interface that brings together public and/or consolidated benchmarking datasets, private participants’ data, and the necessary mechanisms to import and execute benchmarking workflows on an reproducible and authomatic manner. In this way, the platform accomplishes different purposes to different users:
For scientific-community managers, the workbench supports the composition, publication, management and monitoring of community’s benchmarking workflows and challenges.
For participants, the workbench supports the evaluation of their bioinformatics methods or pipelines against community-defined datasets and metrics by participating to registered OpenEBench benchmarking challenges.
Tip
Benchmarking Workflows are docker-based pipelines prepared by the Benchmarking Event manager/s that compute performance metrics for a given participant’s data, i.e., the output produced by the bioinformatics method/pipeline being evaluated. See more at section Benchmarking Workflows.
Overall flow for Participants
Software developers willing to participate to a OpenEBench Benchmarking Event are the end-users of the online workspace. They upload the results of their bioinformatic methods and commit them to registered benchmarking events to eventually obtain evaluations on the scientific performance of their methods. The usual flow of a participant could be summarized in the following steps:

Upload to the platform the results of the method to be evaluated (i.e., list of candidate genes, predicted 3D structures, modeled phylogenetic tree).
Select the relevant benchmarking event and “run it”. Internally, the corresponding benchmarking workflow will compute the metrics qualifying the given data in a on-permisses cloud infrastructure.
Eventually, a graphic visualization is offered to comparatively analyse the obtained metrics with other participating method metrics.
If results are satisfactory, the benchmarking results can be publicated at the OEB portal or where the community stated. If not, they can also rerun the workflow with new data, and compare the results against themselves until they are satisfied with their performance.
Relevant References:
HOW TO: Participe to Benchmarking Events
Overall flow for Benchmarking Event Managers
OpenEBench scientific communities are represented by community managers, whose user account is granted with a set of privileges at the platform. Community managers willing to organize a benchmarking event use the VRE to publish and administrate benchmarking events. Prior publication, managers require to define reference datasets and build the benchmarking workflow that implements the relevant metrics and challenges. Once the event is validated and publicly available, the platform helps monitoring participation, allowing participant assessment’s submission and controlling the overall event life-cycle.
The overall steps to follow when preparing a new benchmarking event are very briefly summarized here:
Be granted a community manager role. Request it for one of the enrolled communitites or lean how to Become a new OEB community.
Provide descriptive information on the new Benchmarking Event: enumerate challenges, define timeline, participation mode, prepare participant’s instructions, etc.
Develop a full benchmarking workflow. It involves the materialization of a set of performance metrics as container-based Nextflow workflow and the definition of golden reference datasets.
Validate and publish the benchmarking workflow at the OpenEBench VRE. The process will enable the corresponding Benchmarking Event.
Relevant References:
HOW TO: Organize Benchmarking Events
CONCEPTS: Benchmarking Workflows
Tools Observatory
The tools observatory aims to monitor the technical quality of research software in the Life Sciences. This is achieved through a comprehensive collection of metadata from different sources, which along with additional computational means, allows the automatic generation of metrics.
Tools Observatory |
|---|
Overview
There are three main kinds of sections in the Tools Observatory:
Metrics: review of software quality indicators from the FAIR perspective.
Our data: a closer look at the data we are using in the “Metrics” section.
Thematic: detailed analysis of different specific topics of interest. “Homepages” section, that analyses tools webpages domains and accessibility, belongs to this kind of sections.
General concepts:
When it comes to tools, we manage three main concepts:
Tool: abstract notion of a given research software, as a computational solution that has been implemented and given an identity name by its author/s.
Instance: an specific materialization of a tool. Instancies of the same tool might vary in the way the users interact wiht it (e.g. command-line applications, web applications, libraires), availability (e.g. desktop and/or web applications) or differences in the code that are not big enough to justify considering them as distinct tools (e.g. different versions of the same software). All the metadata we extract from the various software registries and catalogues apply to instances and ot tools, since the latter are abstractions.
Entry: given an instance, the metadata extracted or generated from each data source.

User Roles
OpenEBench is developed to support multiple and diverse scientific communities. Members of communities may play different roles in the benchmarking process. There are several roles that community members could have.
Community Owner - the person that has an administrative rights over all benchmarking data provided by the community.
Benchmarking Event Manager - the person responsible for the particular Benchmarking Event and all Challenges performed within the Benchmarking Event.
Challenge Supervisor - the person that direct the Benchmarking Challenge.
Challenge Contributor - Benchmarking Challenge Participants that contribute to the Chellenge by either executing benchmarking workflow or by the benchmarking data upload.
Challenge Participant - Participant of a Benchmarking Challenge that executes the benchmarking workflows and keep the benchmarking results private.
For more information about OpenEBench roles please go to the Authentication and Authorization page.
Scientific Benchmarking Data Model
In an effort to standardize the benchmarking process per se, we have developed a refined data-model to reflect the process itself and allow scientists to refer to a particular step and/or data set in a defined way.
OpenEBench Benchmarking Data Model defines the structure of a whole benchmarking process that takes place in the platform. It uses JSON Schemas, based on JSON Schema Draft 04 standard, to validate the objects that are used in the different communities benchmarking services.
Those objects structured to model the elements that come into play in a benchmarking service; and they also have properties/keys that are used to set the values for a particular community and results, or to connect objects between each other.

The schemas that are currently considered in the model (version 1.0) can be found in our data model’s repository. Here is a short description about each of them:
Community: The description of a benchmarking community, like CASP, CAFA, Quest for Orthologs, etc…
Contact: A reference contact of a community, tool, metrics or any other object.
Reference: A bibliographic reference, used to document a community, a contact, a tool, a dataset, a benchmarking event or metrics.
Tool: Software which can be used in the lifecycle of one or more benchmarking communities. Can be a participant in a particular benchmarking challenge, or software used to perform the benchmark itself.
Metrics: Defined metrics which can be computed from a dataset. Could be, for instance, the numerical values indicating some tools performance.
Dataset: Any one of the datasets involved in the benchmarking events lifecycle. So, they can be interrelated (for data provenance) and cross-referenced from the other concepts. There are 7 types of datasets defined in the model, which correspond to the specific data used in the different steps of a benchmarking event (e.g. metrics_reference, participant…) They are further explained in the data types section.
BenchmarkingEvent: A benchmarking event is defined as a set of challenges coordinated by a community, either attended or unattended.
Challenge: A challenge is the evaluation strategy defined by the community. It can be defined by a set of one or more metrics, reference datasets and test actions, related to the participants involved in the challenge.
TestAction: The involvement of a tool in a challenge, taking as input the datasets defined for the challenge, and generating the result datasets in the format agreed by the community. The generated datasets are later related to metrics datasets, which are the metrics agreed by the community for the challenge, used later to assess the quality of the result.
idSolv: This side concept is used to model CURIE’s which are not yet registered in identifiers.org.
Sample JSON files can be validated against these schemas using scripts located in extended JSON Schema validators repository or the online tool JSON Schema Validator.
Find more about the benchmarking data model in our Github repository (https://github.com/inab/benchmarking-data-model).
Scientific Benchmarking Datasets
Datasets: Types and cross-references
OpenEBench data types are defined in the data model, within the ‘Dataset’ schema. These types correspond to the different types of datasets that are used during the lifecycle of a benchmarking event. There are 7 types of datasets defined in the data model:
Public Reference data sets. They are a widespread, publicly available and well characterized data set which can be used by developers and/or interested users to gather performance data of their systems in a controlled set-up. Scientific communities tend to make available Public Reference data to facilitate the engagement of participants within the challenges at hand. These data sets could comprise data from previous benchmarking editions but it is highly dependent on the community and the scientific problem at hand.
Input data sets. Represent the data sets to be processed as input by participants in the benchmarking activities. Those data sets can be publicly available for download at specific repositories e.g. UniProtKB specific reference proteome sets for the Quest for Orthologs participants; and/or can be submitted automatically by benchmarking platform e.g. CAMEO, to participants web-servers. Input data sets should follow at least the same data formats as the Public Reference data sets, and should provide enough metadata describing the data sets to facilitate reproducibility, data provenance and, potentially, the evolution of participants across different benchmarking challenges editions with different input data sets of varying degrees of complexity.
Participant data sets. These data sets represent the data e.g. predictions, produced by participants given a specific Input data set associated to specific benchmarking activities. Depending on the level of automation, participant data sets can be submitted manually e.g. uploaded to a server, and/or automatically e.g. response via APIs implemented in systems like BeCalm. Unless previously agreed, participant data sets are often kept private to participants and/or communities. It would be recommendable that participant data sets which are part of scientific benchmarking publications should be made available for reproducibility purposes, data reuse in downstream analysis and/or further meta-analysis.
Metrics Reference data sets. These data sets contain data used to evaluate the benchmarking process, i.e. the “true” responses to the challenges. These data sets are often kept private by benchmarking events organizers while a challenge is active. This standard practice prevents participants from adjusting their systems to have the best performance for very specific data sets, which is often referred to as overfitting. Overfitting may render systems useless and not-fit-to-purpose and, therefore, it is highly discouraged. Depending on the nature of the Metrics Reference data sets, those can be either “Gold data sets” or “Silver data sets”. It is not uncommon to have both types of data sets as part of a Benchmarking event. When available, Golden data is desirable because it represents the ultimate data that any system should aim to produce. For instance, in the case of Protein Structure Predictions the experimental data deposited in the Protein Data Bank (PDB) is considered to be the “Gold data” for the benchmarking activities carried out by communities such as CAMEO, CASP, and CAPRI. In the absence of a gold standard, benchmarking efforts have to resort to “Silver data”. For instance, synthetic and/or simulated datasets generated in silico following previous experiences or with data generated using unsupervised learning approaches, based on the consensus among different —i.e. algorithmically independent — methods. For the latter, naive methods e.g. Bayesian networks, can provide a baseline allowing assessors to measure relative performance between methods with, on average, moderate to good accuracy. Such consensus data is referred to as “Silver data”. However, data from silver standards should be used with caution as it needs to be revised regularly to adequately evaluate new developments in the field. Often Metrics Reference data sets become public e.g. Public Reference data sets, once a given challenge has concluded because of its intrinsic value to address valuable scientific challenges.
Assessment data sets. These data sets are produced after applying specific metrics e.g. True Positive Rate, to participants data sets while considering metrics reference data sets. Assessment data sets establish how close or far are participants from the expected results. Often preliminary assessment data sets tend to be private to each participant e.g. understanding the initial characteristics of the platforms and/or metrics reference data sets nature; while final assessment data sets tend to be shared among benchmarking participants before the challenge ends, and made public once the events end. Even when participant data sets are not available, assessment data sets can be very useful to measure the performance evolution of different systems versions for the same challenge and/or the complexity of different reference metrics data sets for the same system. Ideally, assessment data sets would allow to track the evolution of both reference metrics data sets and systems versions. However, it would be nearly impossible to deconvolute the impact of each variable into the final results.
Aggregation data sets. These data sets are considered metadata sets grouping either i) assessment data sets from different participants for the same reference metrics data set and applied metrics, ii) assessment data sets from the same participant but for different reference metrics data sets and/or applied metrics in the same benchmarking event, or iii) the grouping of the assessment data sets from the same participant and the same applied metrics across different benchmarking events. Aggregation data sets are the foundations of the community-led scientific benchmarking activities as they offer an unified framework to compare participants performance among themselves for a specific scientific challenge and/or the evolution of individual participants along time. Aggregation data sets allow data bundling and are the ones consumed by experts and non-experts for taking decisions on what systems to use for their own scientific problems. Aggregation data sets can be directly offered at OpenEBench using available views e.g. experts and non-experts data views; and/or using available APIs. Those data sets due to their own nature would be mostly public although they might remain private to scientific communities and/or benchmarking participants while challenges remain open.
All those types are used in the different steps of a benchmarking
experiment, so they can be interrelated (for data provenance) and
cross-referenced from the other concepts (e.g. MetricsEvent defines the
step from a participant dataset to an assessment dataset). The following
figure illustrates how the different dataset are connected through
TestActions.

TestActions can have very different roles. The role is determined by the action type:
TestEvent defines the transition from an input dataset to a participant dataset. In the benchmarking cycle it corresponds to the process when the participant makes its predictions.
MetricsEvent defines the transition from a participant dataset to an assessment dataset. In the benchmarking cycle, it corresponds to the evaluation of the participant’s submission, that is, the computation of the metrics.
AggregationEvent defines the transition from one or more assessment dataset into a single aggregation dataset. In the benchmarking cycle, it corresponds to the consolidation of the benchmark, when - usually the community manager - brings together the results from all the participants and prepares them for visualization.
Datasets: Accessibility
Despite the nature of each data set, it is crucial that all data sets which are part of community-led scientific benchmarking efforts become public during their data life cycle. This effort will incentive open discussions and decisions within the community around which scientific challenges are relevant. Moreover, those efforts can be re-used by other communities and maximizing the data added value. Here, only assessment data sets can be published along with the assessment workflow, making sure that the original data cannot be reconstructed, e.g. for very small datasets. As a general rule, data should follow the FAIR data principles (Wilkinson et al. 2016), which states how to make data Findable, Accessible, Interoperable and Re-usable. This is part of a general movement in favor of implementing the principles around Open Science, Open Data and Open Source.
When defining reference data sets the data ownership is an important aspect. In order to avoid systems overfitting, communities might decide to conduct specific experiments to generate Input and/or Metrics Reference data sets, which are used for specific benchmarking events. In those circumstances and until data is publicly released e.g. via a scientific publication, data is private to the organizers and benchmarking participants should honor that. Thus, a legal mechanism to regulate data ownership and use is highly relevant. Specifically, participants should accept a legal binding agreement which prevents them to use accessed data for purposes different to participating in the benchmarking activities at hand. ~~CAMI (Critical Assessment of Metagenome Interpretation) already implements such policy to guarantee that participants honor such agreement. However, their system cannot change the status easily, given that there is a manual validation of scanned documents step before participants gain access to data.~~
Another important aspect for supporting benchmarking activities carried out for scientific communities is how data is accessed and shared through OpenEBench and associated APIs. As stated before, data should be made publicly through the data life cycle unless ethical and/or legal aspects prevent that. However, the system should be flexible enough to offer scientific community members, organizers and participants control over how data is accessed and distributed at any point in time. Thus, we propose four different data accessibility models in OpenEBench:
Private. This is the most restrictive accessibility model in OpenEBench. In this mode, only the data owner have access to this data as well as the data derived from it, e.g. Assessment data obtained when processing participants data. This accessibility model will facilitate participants to compare themselves with already existing data in a specific Benchmarking event, and might be useful at the initial stages of benchmarking challenges when it is needed to make sure that submitted data is behaving as expected.
Restricted. This accessibility model allows users to share data sets using URLs. This is a very convenient mechanism to foster collaborations among developers of distributed systems as well as to communicate results with restricted audiences e.g. among peers when a scientific manuscript is submitted.
Community based. This is the default accessibility model when a Benchmarking event is on-going. This model allows participants to share and/or compare their system performance, e.g. Assessment and/or Challenge data sets, on real time among community members. This will facilitate open and transparent discussions among community members and it can also facilitate the detection of potential flaws in the setting up of the ongoing event.
Public. This is the default accessibility model for already closed Benchmarking events. This visibility mode allows different stakeholders to have access to data e.g. Assessment and/or Aggregation data sets, and data transformations associated to them, for instance transitions between experts and non-experts views applying different classification algorithms. Making publicly available data is not constrained to finalized Benchmarking events because participants and/or events organizers can make data under their responsibility public. Importantly, once a data set is made public, it should be maintained as such to avoid potential confusion across stakeholders.
Independently of the visibility mode, data should follow the FAIR principles e.g. use of persistent and unique identifiers, because it should be possible to change the visibility mode among available ones e.g. private data could be made available to a whole community; restricted access data can be made publicly available, etc. Moreover, data should be interoperable at any time in and outside OpenEBench to facilitate their access, secondary analysis and/or further re-use by communities running scientific benchmarking activities. OpenEBench will work closely with the ELIXIR Data Platform to identify the most suitable long-term data repositories for data generated at the platform.
Software Metrics
OpenEBench Software Quality Metrics are defined by the Json Schema and can be accessed / updated via Tools Monitoring API.
Here is the brief description of the metrics:
Identity and findability metrics
| metrics | json path | type | description | |
|---|---|---|---|---|
| 1 | canonical:website | project.website | object | Project/software has a web page. |
| 2 | canonical:domain | project.identity.domain | bool | Project/software has its own domain name. |
| 3 | canonical:trademark | project.identity.trademark | bool | Project/software name is trade-marked. |
| 4 | version:robots_compatible | project.website.robots | bool | Could Search Engine Robots track their website? |
| 5 | version:registries | Software registries that include the software. | ||
| 6 | version:scientific_benchmark | Software is a part of scientific benchmark activities. | ||
| 7 | canonical:recognizability | Project/software has a distinct name within its application area. |
Usability: Documentation metrics
| metrics | json path | type | description | |
|---|---|---|---|---|
| 8 | version:help | project.documentation.howto | uri | Whether there is a general help about how to use the tool. |
| 9 | version:tutorial | project.documentation.tutorial | uri | Whether there is a tutorial associated. |
| 10 | version:readme | distribution.sourcecode.readme | Whether there is a readme file distributed along the code. | |
| 11 | version:publications | project.publications | int | Whether the resource has an associated publication. |
| 12 | version:cite | project.documentation.citation | bool | Whether the resource includes an statement on how to cite it and potentially associated algorithms, methods, etc. |
| 13 | version:api | project.documentation.api | uri | Complete API documentation (e.g. JavaDoc, Doxygen). |
| 14 | version:repositories | project.documentation.api_versioned | uri[] | Whether the API documentation is held under version control system. |
| 15 | version:source/comments_ratio | Ratio code/comments, code lines/document lines. It reflects how much the code is documented. |
Usability: Understability metrics
| metrics | json path | type | description | |
|---|---|---|---|---|
| 16 | canonical:description | project.summary.description | bool | Whether high-level description of the tool is available. It should contain concept, rationale and application. By application we understand what the software is for. |
| 17 | canonical:architecture | project.summary.architecture | bool | Whether architectural overview, with diagrams, is available. |
| 18 | canonical:usecase | project.summary.case_studies | bool | Whether case studies of use are available. Example of use. |
| 19 | canonical:concept | project.summary.concept | bool | Whether high-level description of how the tool/software works. |
| 20 | canonical:rationale | project.summary.rationale | bool | Whether design rationale is available. |
| 21 | canonical:application | project.summary.usecases | uri | Whether descriptions of intended use cases are available. |
Usability: Buildability and installability
| metrics | json path | type | description | |
|---|---|---|---|---|
| 22 | version:build_instructions | project.build.instructions | bool | Whether instructions for building the software are provided. |
| 23 | version:installation_instructions | project.deployment.instructions | bool | Whether instructions for installing the software are provided. |
| 24 | version:build_dependencies | project.build.dependencies | bool | Whether the list of all third-party dependencies for proper project build is provided. |
| 25 | version:execution_dependencies | project.deployment.dependencies | bool | Whether the list of all third-party runtime dependencies is provided. |
| 26 | version:execution_test | bool | Whether the software has specific tests to ensure the correct installation. | |
| 27 | version:virtual_environments | distribution.vre | bool | Whether the resource could be built into a virtual environment such as BioConda. |
| 28 | version:type | project.build.automated | bool | Type of the automated build system used (make, maven, ant, etc). |
| 29 | version:package_based_installation | distribution.packages | bool | Whether the software can be installed from pre-configured packages e.g. RPMs, DEBs, PiP, CPAN, PECL |
| 30 | version:language | distribution.sourcecode.interpreted | bool | Code source languange. Whether it is compiled (C, C++, C#) or interpreted (Python, Perl, Ruby). |
| 31 | version:operative_system | project.build.unix | bool | Operative system used to build the software (Unix or Not). |
| 32 | compiler_warnings | Whether the compiler gives warnings. Compilation sucess. | ||
| 33 | version:automated | project.build.automated | bool | Whether an automated build system used. |
Copyright
| metrics | json path | type | description | |
|---|---|---|---|---|
| 34 | copyright_statement | project.website.copyright | bool | Web site states copyright. |
| 35 | credits | project.website.acknowledgement | bool | Web site states who developed/develops the software, funders etc. |
| 36 | consistency | bool | All sites state exactly the same copyright, licencing and authorship. | |
| 37 | copyright_headers | distribution.sourcecode.copyright | bool | Each source code file has a copyright statement. |
Licensing
| metrics | json path | type | description | |
|---|---|---|---|---|
| 38 | project_license | project.license | object | Project has a license. |
| 39 | license_statement | project.website.license | bool | Web site states license. |
| 40 | sourcecode_license | distribution.sourcecode.license | bool | Code distribution includes a license file. |
| 41 | license_headers | distribution.sourcecode.license_headers | bool | Each source code file has a license header. |
| 42 | open_source | project.license.open_source | bool | Project has an open source license. |
| 43 | osi | project.license.osi | bool | Software has an Open Software Initiative (OSI)-recognised license. |
Accessibility
| metrics | json path | type | description | |
|---|---|---|---|---|
| 44 | binary_distribution | distribution.binaries | object | Whether binary distributions are available. |
| 45 | binary_distribution_freeness | distribution.binaries.freeness | bool | Binary distributions are freely available. |
| 46 | binaries_download_registration | distribution.binaries.registration | bool | Binary distributions are available without the need for any registration. |
| 47 | sourcecode | distribution.sourcecode | object | Source distributions are available. |
| 48 | sourcecode_freeness | distribution.sourcecode.free | bool | Source distributions are freely available. |
| 49 | sourcecode_download_registration | distribution.sourcecode.public | bool | Sourcecode is available without the need for any registration. |
| 50 | sourcecode_repository | distribution.sourcecode.repository | object | Access to source code repository is available. |
| 51 | sourcecode_anonymous_access | distribution.sourcecode.repository.anonymous | bool | Anonymous read-only access to source code repository. |
| 52 | sourcecode_repository_browse | distribution.sourcecode.repository.online | bool | Ability to browse source code repository online. |
| 53 | sourcecode_repository_accessible | bool | Make sure the repository (github, bit bucket) contains code. | |
| 54 | sourcecode_repository_version_controlled | bool | Check whether code contains any information about versions/releases/tags. |
Changeabilty
| metrics | json path | type | description | |
|---|---|---|---|---|
| 55 | contributions_policy | Whether the project has defined a contributions policy. | ||
| 56 | issue_tracker | support.issue_tracker.public_tracker | bool | Whether the tool has a publicly accessible issue tracker. |
| 57 | resolve_time | support.issue_tracker.resolve_time | duration | How long are issues open. |
| 58 | governance | project.governance | bool | Whether the project has defined a governance model. |
Benchmarking Workflows
Workflows structure
As seen in the Figure below, our benchmarking workflows are composed of three conceptual blocks (that might be formed of one or more workflow steps), which we encourage the communities to follow for compatibility with our system. Those blocks are:
Validation and preprocessing: the input file format is checked and, if required, the content of the file is validated (e.g check whether the submitted file contains certain fields, or compare to a ‘public reference’ dataset to check if the submitted IDs exist). These are the parameters involved in this step (for more information about parameters visit the ‘workflow parameters’ structure):
Inputs: input, community_id, challenges_ids, participant_id, public_ref_dir
Outputs: validation_result (and an exit status which indicates whether the validation was successful or not).
Metrics Generation: the predictions are compared with the ‘Gold Standards’ provided by the community, which results in one or more performance metrics (e.g. Precision & Recall). These are the parameters involved in this step (for more information about parameters visit the ‘workflow parameters’ structure):
Inputs: input (depending on whether the validation step was successful), community_id, challenges_ids, participant_id, goldstandard_dir.
Outputs: assessment_results.
Consolidation: the benchmark itself is performed by merging the tool metrics with the rest of the community’ reference data. The results are provided in JSON format and SVG format (scatter plot). These are the parameters involved in this step (for more information about parameters visit the ‘workflow parameters’ structure):
Inputs: assessment_results, validation_result, assess_dir
Outputs: outdir, data_model_export_dir

For reproducibility and interoperability purposes, OpenEBench encourages communities managers to submit their pipelines wrapped with a workflow management system (e.g Nextflow) and its tools containerized (e.g. Docker).
NOTE for developers: In order to make the workflow containers reproducible and stable in the long-term, make sure to use specific versions in the container base image (e.g.ubuntu:16.04, NOT ubuntu:latest).
For more information about how to build your own benchmarking workflow, see our TCGA sample workflow at https://github.com/inab/TCGA_benchmarking_workflow.
NOTE for developers: In order to make your workflow compatible with the OpenEBench infrastructure, please make sure to use the same 3-step structure, output formats, and parameter names in it.
Workflow parameters
Description of the parameters used in OEB benchmarking workflows:
INPUTS
input: predictions file submitted by the participants
public_ref_dir: directory which contains one or more reference files used to validate input data.
participant_id: name of the tool used for the predictions.
goldstandard_dir: directory where the ‘gold standard’ or ‘reference data’ to compute the metrics are found.
challenges_ids: list of challenges (performance evaluation methods) which are performed in the benchmark - if you have only one evaluation method, just define a name for it.
assess_dir: directory where the performance metrics for other participants to be compared with the submitted one are found. If there is no other benchmark data yet, an empty aggregation dataset should be defined.
community_id: name or OEB permanent ID for the benchmarking community.
OUTPUTS
validation_result: file path where it is written the validated participant JSON, which corresponds to a minimal dataset compatible with the Elixir Benchmarking Data Model.
assessment_results: file path where it is written the set of assessment datasets in JSON, which corresponds to minimal datasets compatible with the Elixir Benchmarking Data Model.
outdir: directory where the run results are saved - one or more aggregation files used by the visualization, and several SVG/PNG plots.
statsdir: directory where all nextflow statistics (timeline, trace, report…) are written.
data_model_export_dir: file where all the datasets generated during the workflow, which are compatible with the Elixir Benchmarking Data Model, are merged into a single JSON, which is ready to be validated and pushed to Level 1.
otherdir: directory where other community’ specific results can be written.
NOTE for developers: In order to make your workflow compatible with the OpenEBench infrastructure, please make sure to use the same parameter names in it.
Web Components
Technical monitoring widgets
OpenEBench captures and presents large amounts of data. Representation of such data as part of other infrastructures requires a condensed version that can be easily placed in their web layouts and provide a quick overview of the information available, albeit interested users can still link to the main OpenEBench site.
As in the scientific benchmarking component, a number of HTML widgets have been designed and implemented for that purpose. The current widget gallery contains five widgets. These widgets are distributed as simple HTML snippets along with a Javascript file (that bundles opensource 3rd party libraries) which can easily be integrated on any web application.
Examples of the widgets, as well as instructions on how to implement them, can be found here:
Visualization plots
There are currently three available visualization modes in the platform:
2D ScatterPlot: chart that allows to visualize results from challenges that use two performance metrics (e.g precision vs recall). See source code here: https://github.com/inab/OpenEBench_scientific_visualizer
BarPlot: chart that allows to visualize results from challenges that use one performance metric (e.g F-Measure). See source code here: https://github.com/inab/Scientific_Barplot
Benchmarking Event Summary Table: table that summarizes the results of a multi-challenge benchmarking experiment. See source code here: https://github.com/inab/bench_event_table
OpenEBench APIs
OpenEBench platform aims to be a central platform not only to generate, but to publish and distribute benchmarking data across the scientific community. To this end, a set of microservices are publicly offered as REST APIs to retrieve data from the major OpenEBench repositories.
| Data Retrieval APIs | URL | Source code |
|---|---|---|
| OpenEBench Tools Monitoring | endpoint | https://gitlab.bsc.es/inb/elixir/tools-platform/elixibilitas |
| OpenEBench Scientific API (REST + GraphQL) | endpoint | https://gitlab.bsc.es/inb/elixir/openebench/openebench-rest-api |
Those API’s access OpenEBench MongoDBs instances (v4.2.5) and allow users to query for the results they are interested in. Access to OpenEBench is generally authenticated (although anonymous users can be created). In those conditions data and tools access can be restricted as required. OpenEBench will not provide data access credentials. Instead, we will honor the agreements between data users and providers.

Information from these APIs is obtained in JSON format (see partial example on figure below).

It is relevant to note that information can be obtained for specific versions or specific deployments of the tool. This opens the possibility of performing historical analysis comparing the performance and/or availability of different resources versions. More information on the API is available at https://gitlab.bsc.es/inb/elixir/tools-platform/elixibilitas.
Authentication and Authorization
Introduction
OpenEBench authentication and authorization are based on the OpenID Connect 1.0 protocol. The project uses “openebench” realm configuration
of the INB Keycloak server.
Each OpenEBench client must be configured according supposed OpenID flows.
OpenID clients may differ in their configuration, but provided by keycloak configuration endpoint should be enough: .well-known/openid-configuration
Roles
OpenEBench security is based on the concept of roles. Roles go with a set of permissions that allow to perform operations associated with the role.
OpenEBench defines several roles that tightly connected with OpenEBench data model:
Community Owner (owner): person responsible for the entire benchmarking community.
Benchmarking Event Manager (manager): person responsible for the particular benchmarking event.
Challenge Supervisor (supervisor): person that supervises challenge contributors and participants.
Challenge Contributor (contributor): person that contributes to the benchmarking challenge.
Challenge Participant (participant): participant of the benchmarking challenge.
OpenEBench Authentication/Authorization is based on the OpenID Connect 1.0 protocol. The roles are included in tokens as “oeb:roles” claim.


Source Code Repositories
OpenEBench Repository Hub
OpenEBench-related code repositories are mainly stored at GitHub, under different organizations and groups, but always inter-linked and accessible though the documentation hub. It gathers in a comprehensive manner the code repositories of OpenEBench core components (i.e, platforms, APIs, widgets,…), as well as benchmarking workflows developed by enrolled scientific communities, or the benchmarking compoments developed by third party projects supported by OpenEBench. The OpenEBench repository hub can be found here.
Add a new repository to the OpenEBench Repository Hub
The addition of new GitHub repositories to the Hub is automated. The requirement is to add “OpenEBench” as one of the topics of your repository. Shortly, the new repository will be displayed at the Hub. Follow the official GitHub documentation on how to add topics to your repository.
Explore Benchmarking Results
Browsing Online
If you want to explore the benchmarking assessments of an analysis tool or scientific pipeline, the easiest way to do so it through the OpenEBench website. At the web, you can choose the community of your interest and browse among the list of benchmarking events it has organized. Once selecting a particular event, the corresponding summary table gives a rundown of the participants’ assessments.
More detailed evaluations and plots are available for each of the challenges associated to the event. To display them, click on the challenge’s acronym of the column’s headers of the summary table. A full description of the challenge along with the assessment’s metrics used in it are going to be rendered. Learn more at the following section how to interpret the plots to better understand the challenge’s results.

Visualization and interpretation
To compare the peformance of the evaluated resource, it is important to visualize the participants resuls in an appropiate context. OEB offers a gallery of visualization methods that should be picked by the community according to the nature of their data and prospective users. Those visualization methods allow us to interpret and classify the benchmarking results so that they are easily understandable by all kinds of users. Currently, there are three available visualization modes in the platform, thant are descrived bellow.
2D ScatterPlot results visualization
This chart allows to visualize results from challenges that use two performance metrics (e.g precision vs recall), and apply several classification methods that transform them to tabular format, with a green color scale which makes it easier to find out which are the top-performing tools. These classification algorithms look for the optimization of the challenge metrics in order to group the tools according to their proximity to the ‘ideal performance’.
Square quartiles - divide the plotting area in four squares by getting the 2nd quartile of the X and Y metrics. This classification method basically splits the participants set in half by each of the metrics using the second quartile. By drawing a line over the quartile values in the plot, the area is divided in 4 groups that might not contain the same number of participants. These groups were then rated according to the performance of the participants within them; the square which overlaps with the ‘optimal performance’ corner is considered as the best group, followed by the one on its right/left, then the one over/under it, and finally the one in the opposite corner. However, this order may change according to the requirements of the supported community.

Diagonal quartiles - divide the plotting area with diagonal lines by assigning a score to each participant based in the distance to the ‘optimal performance’. After normalizing the axes to the 0 - 1 range, the score is computed as the sum of the distances of each of the points to the axes; the higher that score is, the closer that participant is to the ideal performance. Linear quartiles classification was then applied to the scores dataset, obtaining three scores that group the participants in four classes - each of the groups is expected to have roughly the same number of participants. These groups were then rated according to the performance of the participants within them: the groups showing the highest score were considered as the first quartile (best performance).

Clustering - group the participants using the K-means clustering algorithm, which groups data by trying to separate samples in n groups of equal variance, minimizing a criterion known as the inertia or within-cluster sum-of-squares. This algorithm requires the number of clusters to be specified, for consistency with the rest of the methods, it is by default set to four; however we could offer communities new visualization modes where the number of clusters can be customized. Once the algorithm converges, the groups are sorted according to the performance of the participants within them. In order to do that the clusters’ centroids are considered as ‘new’ participants, representative of the full set of tools within a group and computed the score as we did in the diagonal quartiles method. That set of scores is then sorted to assign a ranking to each of the clusters. In order to visualize the different clusters in the plot the cluster number is shown next to each group, and a polygon is drawn grouping all the cluster’ participants.

An interesting feature of this plot is the interactivity, the elements of chart’s legend and table are clickable so that the end-user can hide the participants he is not interested in and/or lay far from the area of interest; and the classification is dynamically recomputed.
For more information, visit its official Git Repository
BarPlot results visualization
This chart allows to visualize results from challenges that use one single performance metric (e.g F-Measure), and transform them to tabular format, with a green color scale which makes it easier to find out which are the top-performing tools.
In this chart each of the bars corresponds to a participant in the challenge, while the Y-axis corresponds to the evaluation metric. The transformation to table is achieved by sorting the participant by the value of the metric in descending order, and then applying lineal quartiles classification to the metrics dataset, obtaining three scores that group the participants in four classes - each of the groups is expected to have roughly the same number of participants. These groups were then rated according to the performance of the participants within them: the groups showing the highest (or lowest, depending on the metric) values were considered as the first quartile (best performance).

For more information, visit its official Git Repository
Benchmarking Event Summary Table
The summary table condenses the results of a whole benchmarking event in a single table. Each of the columns corresponds to the quartiles/clusters of applying one of the classification methods described in the 2D ScatterPlot section, highlighted in green the top-performing tools. This view offers the possibility to see, at a glance, the overall results of a tool’s performance across all the benchmarking challenges in a particular event.
For more information, visit its official Git Repository

Explore Tools Monitoring Data
A set of quality software metrics are systematically gathered for an extensive collection of bioinformatics tools and workflows. Here, we describe how to browse it either at the OpenEBench Web Portal, or using a REST interface.
Note
See section Software quality metrics to learn more on what benchmarking metrics are available, how are they collected or computed, or what are the reference tool’s registries.
Browsing online
The ‘Tools Monitoring’ section is accessible at the homepage of the OpenEBench Web Portal (https://openebench.bsc.es).
The tools monitoring section allows to perform an interactive search, querying the collection of tool by titles, descriptions, type or other relevant annotations like EDAM’s operation and topic terms. See figure below:

The selection of a given tool gives access to the specific card (Figure below) where general information of the tools, their possible implementations and links to the sources of information are available.

In addition to the general metrics indicated in the Software quality metrics, OpenEBench Tool Card includes life information about the availability of the tool, as obtained from monitoring the relevant URLs. This check is done in a daily basis and includes, up/down state, time of response, and for encrypted (https) links the validity of the encryption setup. This image shows an example of such information:

Finally, an updated record of the citations received by the publications associated to the tool is provided in the tool entry. The procedure to obtain the list of citations is the next:
Fetch from OpenEBench the list of tools with bibliographic references (i.e. PubMed Ids, DOIs and/or PMC ids).
For each one of these bibliographic references, query several bibliographic sources for records about them. We are currently using Europe PMC, NCBI PubMed, and WikiData, through their programmatic APIs, as bibliographic and citation providers. For each source, a correspondence from each bibliographic identifier and its internal id is obtained.
For those matched identifiers, additional details are recovered, like their title, augmented and curated set of bibliographic identifiers, year of publication and the list of authors. Also, with the unique internal ID, the list of internal identifiers of manuscript references and each known citation is obtained. Then, the details of each identifier in the reference and citation lists are fetched, in order to classify them by year.
After this, there is a consolidation phase for each tool’s bibliographic reference, where the gathered citations from all the sources are integrated, so only the unique citations are used for the statistics. The public, bibliographic identifiers of each citation are used for that.
The image below shows an example of the resulting plot.

Additionally, a complete set of statistics about the contents of the data warehouse are available through the statistics tabs:

RESTful API
Although OpenEBench website gives access to all information stored in the data warehouse in a friendly manner, the platform is designed to provide information in a way that can be integrated other infrastructures. To this end a series of RESTful API’s have been developed. Go to OpenEBench APIs section in Technical References for more information.
OpenEBench Tools Monitoring |
|||
Participate in Benchmarking Events
These guides will help you go through the different aspects rellevant for benchmarking the outcome of your tool or pipeline as part of an open OEB benchmarking event. The overall process is described in this figure.

Prepare the participant data, i.e., the dataset to be evaluated. Instructions on how to generate and format it are specific to each benchmaking event, so counsult the challenges’ rules at the organizater’s website. It is also usually linked at the OpenEBench Event entry of the organizing community.
Upload it to the OpenEBench Virtual Research Environment and evaluate your participant dataset selecting the benchmaking event you are interested in. Behind the scenes, the execution of a benchmarking workflow will be triggered to generate a set of datasets containing your assessments. You can visualize and compare them against other event’s participants.
Once satisfied with your results, you can submit your assessments to become public and accessible at OpenEBench website. According to the event’s specification, the publication process might require the approval of the organiziers.
Optionally, you can export your benchmarking results. OpenEBench helps your to publish your benchmarking datasets to EUDAT, a long-term data infrastructure that will issue a D.O.I. for your data.
Read the following documentation to learn more on each of these steps.
Evaluate your tool
If you want to evalute your tool using one of the open benchmarking events in OpenEBench, these are the steps you need to follow:
First step is to make sure your tool is added in bio.tools or bioconda or Galaxy Tool-Shed. These three repositories are the sources of information about the tools in OpenEBench.
Then, you need to run your tool using the specific parameters you want to evaluate and get the corresponding predictions that will be used for the benchmarking. This is the data that will be used as input for the benchmarking worflows.
The predictions that you previously obtained, will be evaluated with the benchmarking workflows already made avaiable in the Virutal Research Environment platform, in order to evalaute the performance of your tool. To do that, you need to upload to the platform the results of the tool interested in evaluating that you generated in the pervious step.

Then, select the relevant benchmarking event and “run it”. Internally, the corresponding benchmarking workflow will compute the metrics qualifying the given data in a on-permisses cloud infrastructure.

Eventually, a graphic visualization is offered to comparatively analyse the obtained metrics with other participating method metrics.

If results are satisfactory, a member of the OpenEBench team will be able to publish your results in the web server where they are going to be visualized.
Publish your data to OpenEBench
OpenEBench community managers and participants can upload the results of their benchmarking events to find them publicly available at the OpenEBench portal. The publication process is available online through the Virtual Research Environment, upon the organizator’s event approval. Community managers can also push the data in a programmatic way using the corresponding REST API. Find more details below.
.drawio.png)
Using the Research Environment
As seen in the Figure below, user execute the benchmarking workflow in the Virtual Research Enviroment. All user files, input and outputs datasets of the workflow are private for user. Then user can decide if they want to publish the datasets to OpenEBench. Only afterwards, the possiblity to publish the datasets to remote repository EUDAT will be allowed.

What benchmkarking data can be published?
To publish data to OpenEBench portal, two types of datasets are allowed:
Participant dataset: Produced by participants with their tool from a specific input data.
Participant Assessments dataset: It includes participant data and assessment data. Generated once a benchmarking worflow has been successfully executed.
Note
For more details, see the Scientific datasets reference.
In order to publish in OpenEBench, these datasets must belong to an active benchmaking event, it means that a benchmarking workflow in VRE must have been executed. More info: Evaluate your tool.
As the process to publish includes to associate the data to a registered OpenEBench tool, participant tool must be registered in OpenEBench first in order to asign an OpenEBench id for the participant tool. More info: Register your tool.
Why should I publish data to OpenEBench?
As metion before, OpenEBench is the benchmarking and technical monitoring platform for bioinformatics tools, web servers and workflows. Publishing data from the benchmarking workflows implies:
Data will become publicly available on the OpenEBench data portal.
Data will receive a unique OpenEBench identifier. This allow user to afterwards refrencee that data in publications or publish it to a remote repository, B2SHARE. More info: Register your tool.
Data will be stored on the internal OpenEBecnh datastore (not persistent)
Who is allowed to do?
Any user with a minimum role contributor can request to publish their files in OpenEBench.
To request an upgrade role, please see the section: Request a role upgrade.
How do I publish data to OpenEBench?
Log into the Virtual Research Environment (VRE) and go to Publish/OEB/New Request tab:
Note
More info: Virtual Research Enviroment.

It appears the list of files available to publish from user workspace. Select which file/s to publish.

Complete the form with the information of each dataset. You will be asked for your tool used to compute the participant data. It has to be registered in OpenEBench. Also any contact to introduce have to be in OpenEBench.
Data_to_be_published

A summary of the form is showed. Click submit to request to publish these data. Message with successfully request should appear.

Once the request is sent, you can follow and manage it in Publish/OEB/Manage Request. In actions column, you can cancel it. The request can be cancelled only when it is in pending approval status.

Once approved, the data will be publicly available in the OpenEBench.
Using the REST API
OpenEBench Community Managers can upload the results from their full benchmarking event to the platform by using one of the scientific APIs (https://openebench.bsc.es/api/scientific/submission/) . In order to do that they have to:
Covert their full experiment to the official Benchmarking Data Model - datasets, tools, challenges… Please contact the OpenEBench team if you need any help in adapting your benchmarking process to the data model concepts.
Validate the full set of generated JSON objects against the official Benchmarking Data Model using this JSON Schema validator.
Register the community and manager contact (if not already done) - now this is done by OEB managers with the community and main contact objects. New managers will be assigned an username and password.
Merge the set of JSON objects into a single array. In Linux systems, executing the following command in the root directory that contains all files does the trick : jq -s . $(find . -type f -name “*.json”) > your_file_name.json (jq library needs to be installed).
Upload the array of JSON objects to the temporary database (using the assigned username and password) with the following command : curl -v -X POST -u <user>:<passwd> -H “Content-Type: application/json” https://dev-openebench.bsc.es/api/scientific/submission/?community_id=OEBC002 -d @your_file_name.json
Send an email to openebench-support@bsc.es containing the name of the JSON objects uploaded to the temporary database.
Wait until the OpenEBench team moves the data to production OpenEBench Mongo DB.
Data is ready to be visualized in OpenEBench.

Publish your data to EUDAT
EUDAT is an European project to develop a Collaborative Data Infrastructure (CDI) which provides means for managing large distributed collection of digital objects, maintaining metadata and applying data management policies.
B2SHARE is the EUDAT user-friendly, reliable and trustworthy service for researchers, scientific communities and citizen scientists to store and publish research data from diverse contexts. More information: EUDAT-B2SHARE.
Using the Virtual Research Environment
OpenEBench offers a Graphical User Interface to upload benchmarking data to B2SHARE remote repository. B2SHARE is distributed in communities. OpenEBench has its own community there. Using the Virtual Reaserach Enviroment to upload data in B2SHARE, it will be push it in the OpenEBench community (OpenEBench community).
.drawio(2).png)
What benchmkarking data can be published?
Participant dataset
Participant Assessments dataset
Aggregation dataset (once benchmarking event is closed, done by event manager)
Prerequisites
In order to publish your data in EUDAT OpenEBench community, it is necessary to link your Eudat account in Virtual Research Enviroment:
First you need to register in EUDAT and generate an access token. (Generate Eudat token). Afterwards, you can easily link your Eudat account in VRE, going to your profile / keys tab.

Introduce your access token and your email used to register in Eudat. Your account will be successfully linked.
Who is allowed to do?
Benchmarking event contributors
Managers events
Note
Check your asigned role: Account details.
How do I publish data to B2SHARE from Virtual Research Environment?
Select your datasets to publish

Fill the metadata form and confirm the dialog.

Your data has been successfully published to EUDAT.
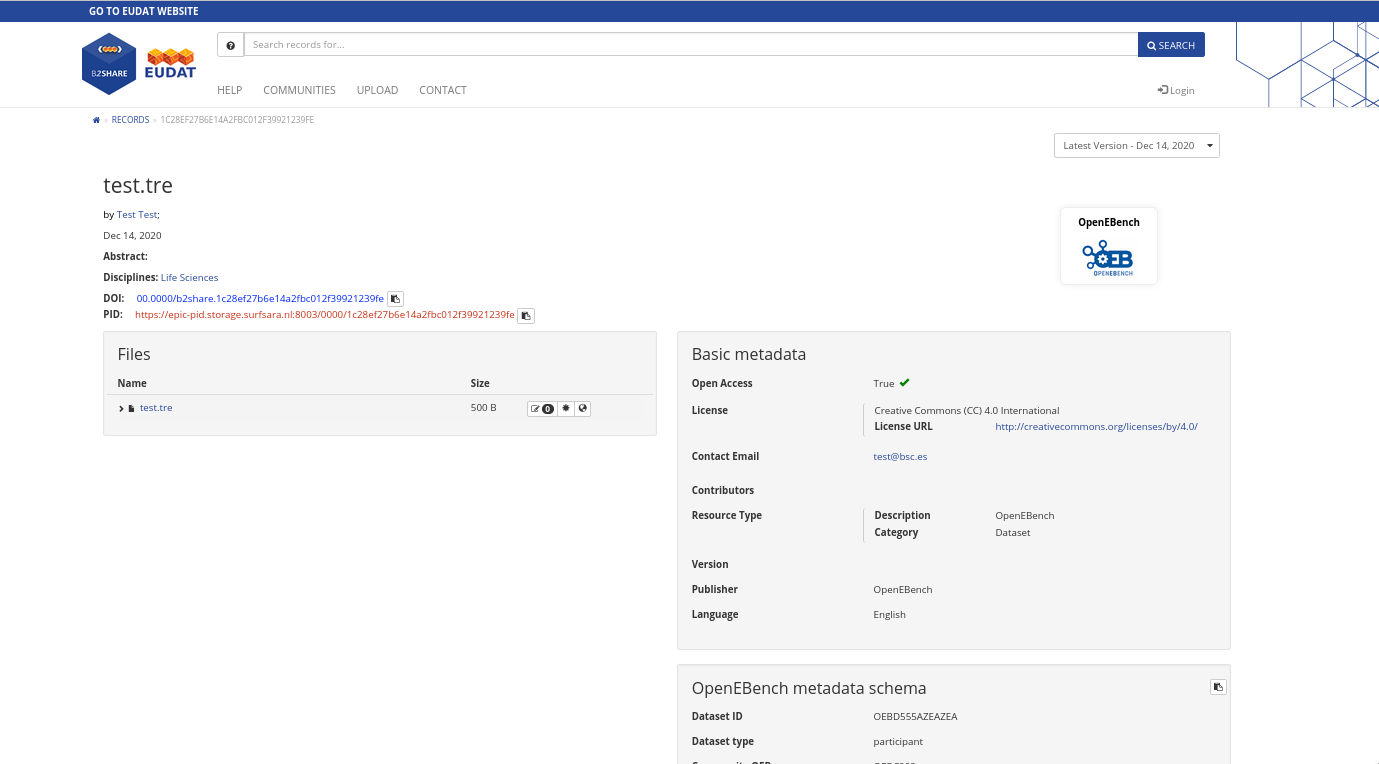
Organize Benchmarking Events
Who
OpenEBench roles, as described in the Authentication and Authorization section, grant certain privileges to a the user account they are related to. In order to be able to create a Benchmarking Event for the community you belong to, you should make sure your account has one of the following roles:
Community Owner, able to administrate all the events happening in the context of its community.
Benchmarking Event Manager, able to manage a particular Benchmarking Event.
The roles mentioned above not only allow the user to create new Benchmarking events, but also to accept or deny the participant assessments willing to be part of the contest. Learn what are your privileges checking your user’s profile, and request for the appropiate role if necessary following the instructions at Manage User Accounts.
How to prepare a Benchmarking Event
To be able to register a new Benchmarking Event, two interrelated items need to be prepared by the organizer:
A set of metadata defining the new Benchmarking Event.
A benchmarking workflow implementing the metrics of the Benchmarking Event.
The following seccions explain in detail how to prepare both items. Eventually, this data will be loaded to the OpenEBench platform by the user. However, currently there is no specific user interface to do it automatically and should be done by a member of the OpenBench support team. The communication with the team is via the following email: openebench-support@bsc.es. Please, don’t hesitate to contact us for any doubt or issue.
Step 1: Benchmarking Event definition
This step consists on formaly defining the Benckmarking Event to integrate it at the platform. Please, send us a copy of this form with the information of the Benchmarking Event you want to create.
Step 2: Benchmarking workflow implementation
This step consists on building a set of software containers following OpenEBench guidelines and good practices. These containers have specific purposes as part of a 3-steps workflow that will assess a participant dataset using a set of objective and unbiased metrics. The workflow must follow a particular structure as detailed in the section Benchmarking Workflows. Eventually, the workflow should be ready to be integrated in the OpenEBench platform in the context of a specific Benchmarking Event for a community. In order to do that, these steps need to be followed:
Create the canonical docker containers taking as reference the following repository: TCGA Cancer Driver Benchmarking dockers.
Clone the given repository and take it as a template to prepare your own containers.
Define the format of the participant’s dataset and build the validation container accordingly.
Build the metrics container that will output the report assessing the participant. For that, the developer requires:
Define golden or reference dataset(s).
Develop the relevant metrics and apply them to the given participant dataset.
Build the final report following the OpenEBench data model. For an eventual integration, make sure the following reported terms are in agreement with the formal definition of the Benchmarking Event (previous section):
Challenge’s acronyms
Metrics names
Make sure the given consolidation container produce the expected plots from the report generated by the metrics container.
Compose the Benchmarking Workflow from the canonical docker containers taking as reference the following repository: TCGA Cancer Driver Benchmarking workflow.
Clone the given repository and take it as a template to prepare your own workflow. Most of the changes would correspond simple adaptations for:
Input and output file paths
Image container names
Run locally the workflow as instructed at the repository’s documentation.
Send to the OpenEBench support team the resulting implementation via email. Make sure to indicate:
The URL of the repositories and the specific tag commit.
The location of the golden reference data.
A test data including a valid participant dataset and the expected output files of the workflow execution.
Manage User Accounts and Roles
Register to OpenEBench
Why I should be registered on OpenEBench?
There is no need to be registered at OpenEBench for accessing a good part of the platform services, like browsing tools’ monitoring data at OpenEBench portal, or exploring software metrics at the Tools Observatory, or checking the results of a scientific benchmarking challenge once published by the community. However, processes actively contributing to generate benchmarking data or programmatically accessing to some OpenEBecnh interfaces requires an active OpenEBench user account.
Requirements
A valid email account
Accepting OpenEBench Terms of Use
How I can register?
OpenEBench portal, the Research Environment, or any other OpenEBench platform supporting authenticated users, has a user’s dedicated section at the website top-right corner. From there, the registration web form of the centralized autentication system is accessible. However, this is a direct access to the registration form.
The new account is automatically activated after email’s validation with the minimal OpenEBench user’s role: "oeb:roles": ["member"] . If a service or action is not allowed with the default setup, you need to request a role upgrade.
Display your account details
Once logged in, the details of your user account are accessible from the user’s section of the website top-right corner.
At the OpenEBench Virtual Research Environment, the section shows a short summary of user’s personal data, together with the information of any associated account (i.e. EUDAT,…).
User Access Token
More technical details of the user account are displayed at the API Keys tab of the same page. OpenID Connect access tokens used to programatically authenticate the user against any OpenEBench RESTful API (see more at REST APIs ) are displayed here.
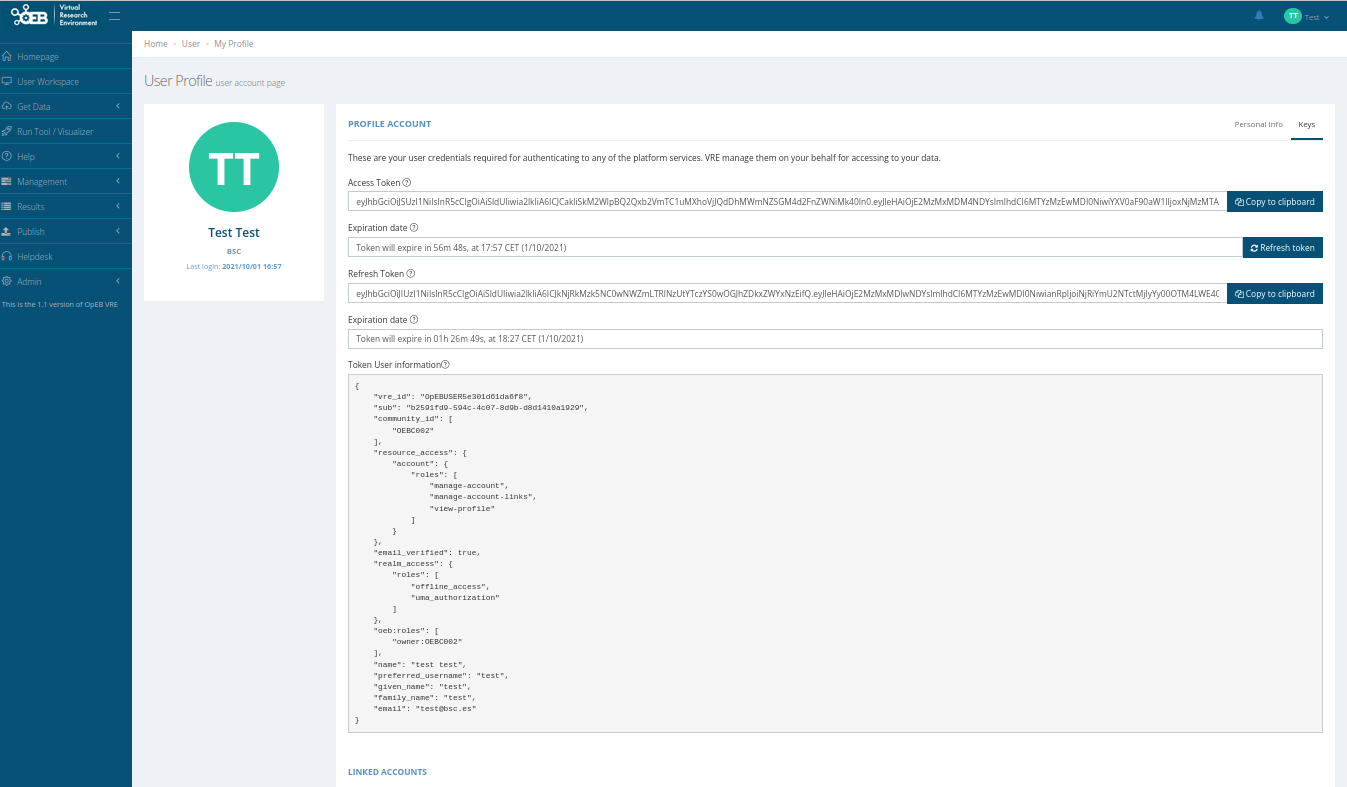
User Role and Community
The API Keys tab also displays in clear the information contained in the OpenID Connect ID Token. It includes some standard OIDC claims (i.e. sub, name, email…), as well as other OpenEBench specific claims, for instance, the OpenEbench role or the membership to a scientific community.
This is an example of an OpenID Connect ID Token as displayed at the user’s section of the Research Environment:
{
"sub": "db2c9993-92d7-4201-b922-0a5660b39743",
"name": "Demo",
"given_name": "Demo User",
"preferred_username": "tcga_owner",
"family_name": "",
"email": "tcga_owner@bsc.es"
"resource_access": {
"account": {
"roles": [
"manage-account",
"manage-account-links",
"view-profile"
]
}
},
"email_verified": true,
"realm_access": {
"roles": [
"offline_access",
"uma_authorization"
]
},
"vre_id": "OpEBUSER600707d480ce6",
"oeb:roles": [
"owner:OEBC001"
]
}
Request a role upgrade
Certain services or operations at the OpenEbench platform require being granted with a particular role to your user account. Each role is associated to a set of permissions and allowed operations (see Authentication and Authorization section). If you are willing to perform one of these privileged actions, you just need to request a role upgrade. Learn how to check your active roles at Display your account details.
Currently, we are in the process of developing a complete web interface for managing this kind of petitions in a friendly manner. Meanwhile, we are centraling role upgrade petitions to our support email. We receive them and we redirect those that need to be approved by users not belonging to the OpenEBench Support Team (i.e. scientific community owners, benchmarking challenge managers, etc.).
How can I request a role upgrade?
Send an email to openebench-support@bsc.es from the your email account registered in OpenEBench. The message should contains:
The privileged operation your are not currently allowed to perform. Check them Authentication and Authorization section. Examples are:
Membership to one of the scientific communities
Publication of benchmarking datasets belonging to a certain Benchmarking Event or Challenge
Registration of Benchmarking Workflows at the Research Environment
If applicable, the scientific community framing the privileged operation.
Approve and reject role upgrades
Currently, we are in the process of developing a complete web interface for managing this kind of petitions in a friendly manner. Meanwhile, we are centraling role upgrade petitions to our support email. We receive them and we redirect those that need to be approved by users not belonging to the OpenEBench Support Team (i.e. scientific community owners, benchmarking challenge managers, etc.).
Glossary
- Benchmarking Event
Time-bound contest where a tool, pipeline, service or product, i.e. the participant, is compared against other participants using a predefined collection of reference datasets and assessment metrics.
- Benchmarking Workflow
Docker-based pipeline prepared by benchmarking event manager/s that calculates the performance metrics for a given participant’s dataset. A Benchmarking Event consumes behind the scences a Benchmarking Workflow with a particular set of golden reference datasets. See more.
- Challenge
Each of the categories in which a benchmarking event is divided. In its simplest form, one challenge comprises one reference dataset and one or more evaluation metrics. This can be customised if needed.
- Community
The organised group behind the benchmarking.
- Participant
Software application (program, server or pipeline) evaluated within a benchmarking event in at least one challenge. The same program can participate multiple times if various versions or parameter settings are benchmarked separately.
- (OpenEBench) Virtual Resarch Environment (VRE)
Cloud-based analysis platform where the assessment of the participants’ datasets takes place. The platform executes in a transparent and reproducible way Benchmarking Workflows . URL: https://openebench.bsc.es/vre/ . See See more.